This page provides links to figures produced from QTCM model output and observations with GrADs. They approximately follow the figures found in Zeng et al, 2000 from QTCM V2.1.
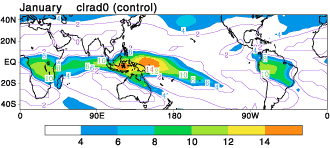
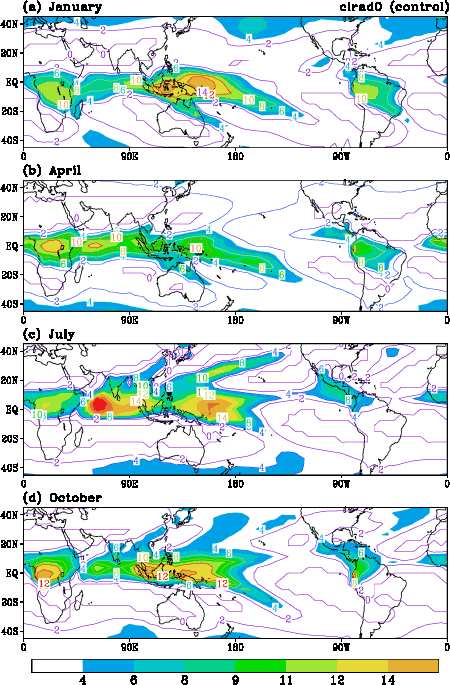
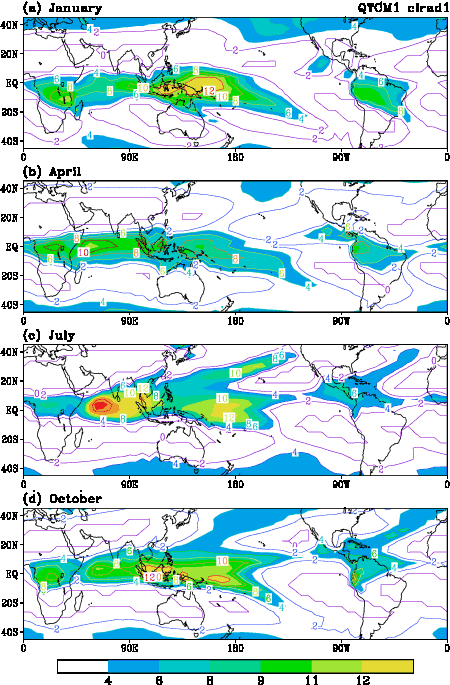
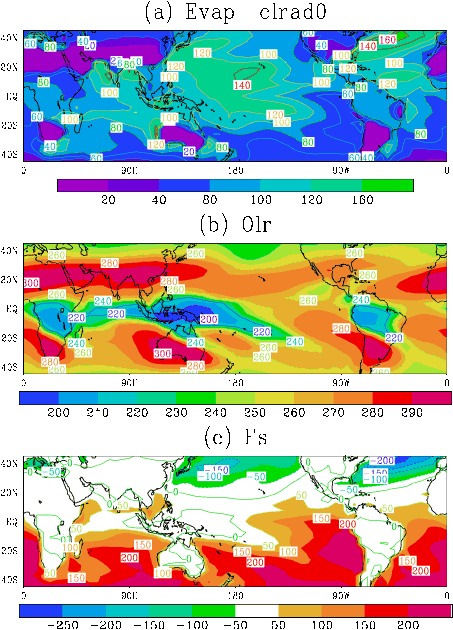
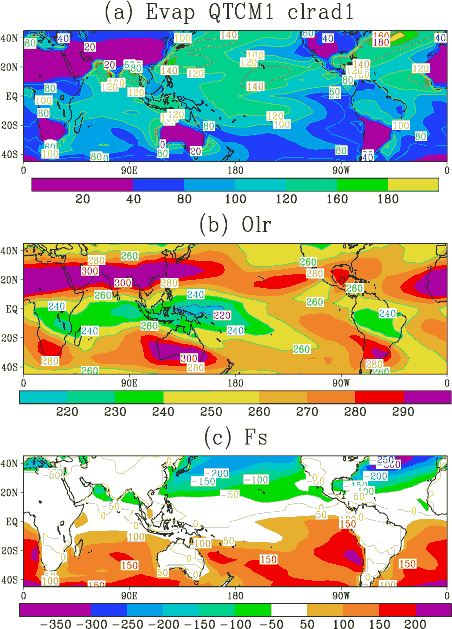
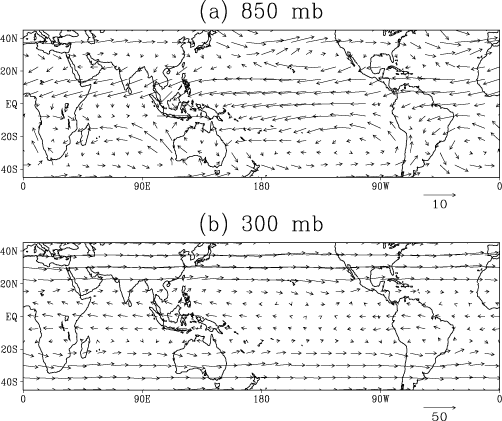
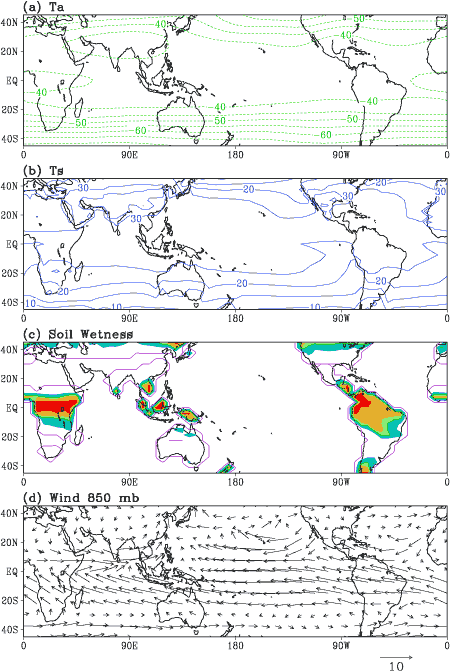
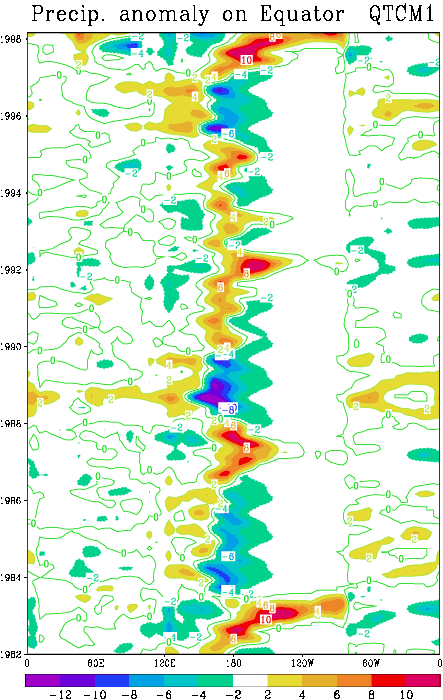
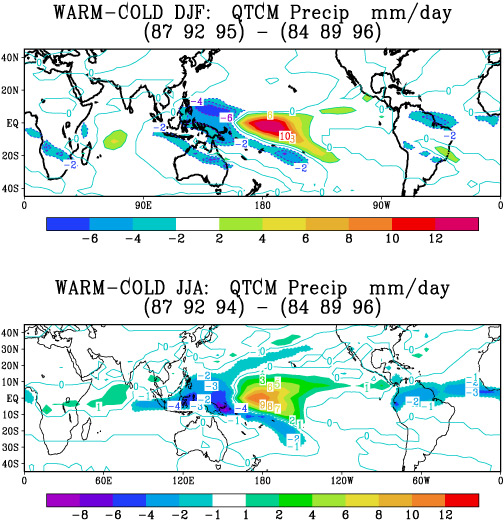
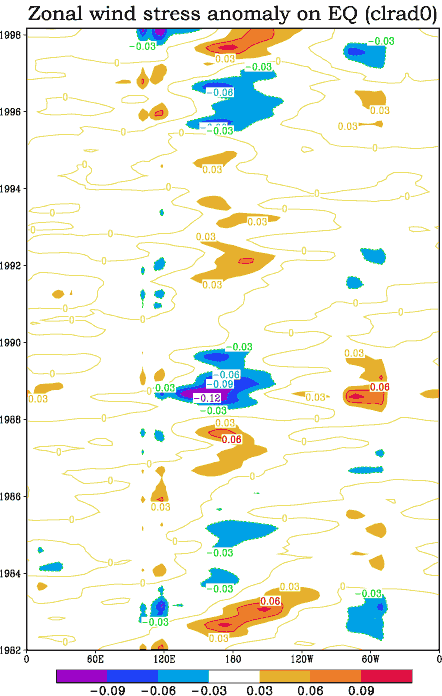
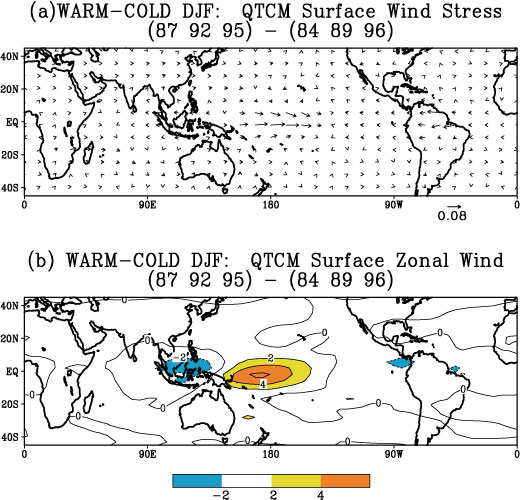
Model (QTCM1V2.0) climatology January mean precipitation for the period 1982-1998.Model climatological monthly mean precipitation for the perion 1982-98; using the cloud-radiation package clrad0. (a) Jan, (b) Apr, (c) Jul, (d) Oct. Contour interval 2 mm/day, shaded above 4 mm/day.Model climatological monthly mean precipitation for the perion 1982-98; using the cloud-radiation package clrad1. (a) Jan, (b) Apr, (c) Jul, (d) Oct. Contour interval 2 mm/day, shaded above 4 mm/day.Model-simulated Jan fluxes using cloud-radiation package clrad0 of (a) evaporation, contour interval 20 W/m*m; (b) outgoing longwave radiation, contour interval 20 W/m*m; (c) downward net surface energy flux, contour interval 50 W/m*m.Model-simulated Jan fluxes using cloud-radiation package clrad0 of (a) evaporation, contour interval 20 W/m*m; (b) outgoing longwave radiation, contour interval 20 W/m*m; (c) downward net surface energy flux, contour interval 50 W/m*m.Model-simulated Jan climatological winds at (a) 850, (b) 300 mb, in m/s.Model Jul climatology: (a) air temperature averaged between 500 and 200mb, contour interval 5C; (b) surface temperature (simulated ground temperature and observed SST), contour interval 5C; (c) relative soil wetness, contour interval 0.2; (d) 850 mb winds in m/s.Model-simulated monthly mean precipitation on the equator through the period 1982-98. Contour interval 2 mm/day.ENSO composite precipitation differences. Three warm events (1986/87, 1991/92, 1994/95) minus three cold events (1983/84, 1988/89, 1995/96). (a) Northern winter (Dec-Feb), (b) summer (Jun-Aug). Contour interval 1 mm/day.Model-simulated zonal wind stress on the equator from 1982-98, using cloud-radiation package 0, contour interval 0.03 N/m*m.Dec-Feb ENSO composite differences as above: (a) surface wind stress in N/m*m; (b) surface zonal wind in m/s.