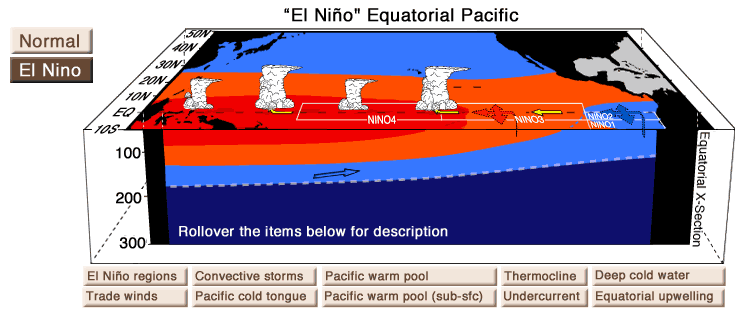
El Niño is a phenomenon in which the sea surface temperatures (SSTs) in the central and eastern tropical Pacific Ocean are warmer than average. Scientists look at the average SST in the boxes in the image below (called Niño1-4 regions) to determine whether an El Niño event is happening. The opposite of El Niño is La Niña, which occurs when SSTs are cooler than average in the same region.
El Niño and La Niña evolve year-round, but the biggest changes in SSTs tend to peak during the winter in the northern hemisphere (the December-January-February months). El Niño gets its name from South American fishermen, who noticed the changing ocean temperatures around Christmas time and referred to the phenomenon as “El Niño,” the Spanish term for Christ child.
El Niño and La Niña are also referred to together as the “Southern Oscillation,” which was a term coined by Sir Gilbert Walker when he studied sea level pressures and how they oscillates between high and low in the tropical Pacific Ocean. Collectively, scientists refer to this phenomenon as ENSO, or the El Niño-Southern Oscillation. Note the word oscillation means ocean temperatures tend to oscillate back and forth, from El Niño to La Niña or neutral conditions and back again, and this occurs on a time scale of about 3-5 years.
Varieties of El Niño
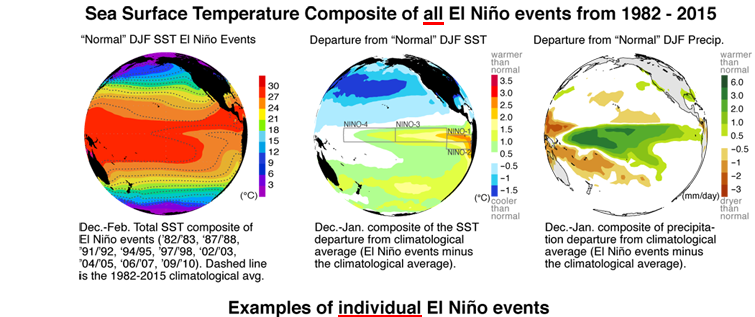

Recall that El Niño occurs in the tropical equatorial Pacific Ocean, and it returns every 3-5 years. Exactly where and how much the sea surface temperatures (SSTs) change during El Niño can vary. Scientists refer to this as variations in location and intensity. The biggest SST increases can occur in the eastern Pacific Ocean and can be very large (see the middle image for the 1997/’98 El Niño). Sometimes these increases occur closer to the central Pacific Ocean, instead (see the middle image for the 1991/’92 El Niño).
You can also see that the magnitude of SST change is different in these two events: the 1997/’98 El Niño is one of the strongest on record. Also note that the magnitude of SST changes for the current 2015/’16 El Niño are about as large as those for 1997/’98. Variations in the location and intensity of SST changes during El Niño affects where and how much precipitation falls along the west coast of North America, as well as many other places (right panels). Go to our Global effects section to learn more about how El Niño affects the atmospheric circulation and leads to drier and wetter winters across the world.
Global effects
Although the origin of El Niño lies in the tropical Pacific Ocean, its effects are felt over a large portion of the Earth. These remote effects are called teleconnections (from the Ancient Greek tele, meaning distant).
The ocean and atmosphere are always in a perpetual tug of war, trying to balance out disturbances and come to a place of equilibrium. This is achieved by wave action. Imagine a drop of water added to the middle of a bucket of water. The depth of the water increases on the whole; it does not increase solely at the point where the drop landed. The change in height for the whole is achieved by wave action. In the case of the atmosphere, which behaves like a fluid, we speak in terms of the height of the pressue levels the centers of which are called high and low pressure systems as seen in the animation below and which are the mechanisms which transmit the teleconnections.
The ocean surface affects the air above it through the transfer of energy. In the tropics, there is a vast amount of energy associated with warm water–enough to affect the entire column of air from the surface to the top of the weather-making part of the atmosphere (this is approximately around 10 kilometers height or above, or a little more than 6 miles in altitude, which is about the cruising altitude for many commercial jets).
As the warm water shifts location during El Niño, convection and precipitation changes. This warms the tropical atmosphere up until about 10 kilometers height and causes high atmospheric pressure to form on either side of the equator. These pressure changes spread like waves through the atmosphere, and this leads to changes in the winds high up in the atmosphere. These winds, referred to as jets, are vital in steering storms. When the winds change, the path of the storms will also change.
To see how shifts in the jet stream affect precipitation in North America and California in particular, go to our California connection section.
California Connection

Recall from the Global effects page that during an El Niño, sea surface temperatures in the equatorial Pacific cause changes in atmosphere above it that leads to an extension of the jet stream at upper levels (10km up). This shift, on average, tends to bring more storms to the California coast. Below, you can watch how El Niño changes the path of storms during the winter to produce a wet winter for California, and you can compare it to the dry winter of 2014.
The above movie shows satellite observations of rainfall from the Tropical Rainfall Measuring Mission (TRMM) satellite. The top two maps show winter storms during an El Niño winter (left) and a winter during the recent California drought (right), in units of millimeters per day. The bottom two maps show the accumulated rainfall for these same storms.
During any given year, storm systems cross the Pacific Ocean and are steered by the jet stream, which is a region of high winds at upper levels (about 10km) that help “push” or guide storms traveling east across the Pacific. This happens every winter, regardless of whether it is an El Niño winter, a La Niña winter, or neutral conditions.
During an El Niño winter, the ocean warming at the equator sets off a chain reaction that affects the atmospheric circulation at the equator, altering the jet stream by making it stronger and extending it toward the California coast. This causes more storms than normal to approach the California coast. (Otherwise, these storms would hook north and hit the Pacific Northwest, which is why Seattle and Portland tend to have such rainy winters.) To see a movie of this, make sure you check out our Global effects section.
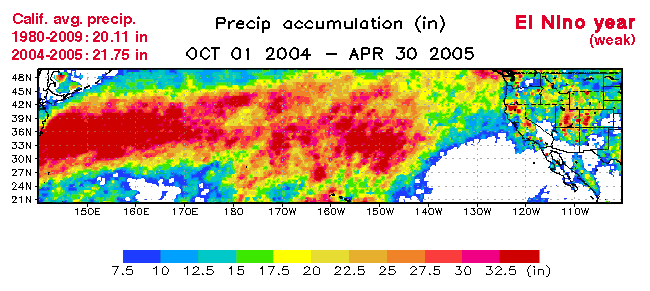
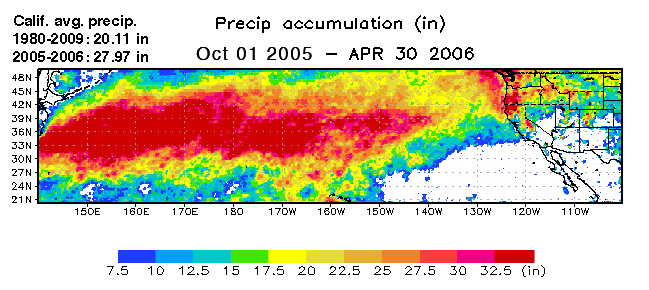
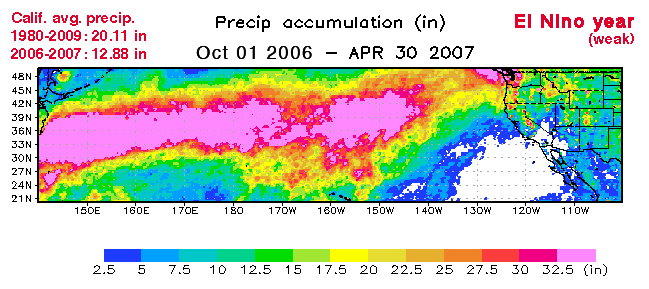
It is important to remember that not all El Niño winters produce the same changes to the jet stream and pathways of storms. A stronger jet stream and wetter California is more likely to happen during a moderate-to-strong El Niño. For instance, the 1997/’98 El Niño was very strong, and California had higher-than-normal precipitation. In contrast, there was a weak El Niño during the 2014/’15 winter season, and California had lower-than-normal precipitation.
The current 2015/’16 El Niño is expected to be strong (comparable to that of 1997/’98). While this makes higher amounts of precipitation more likely, it is not guaranteed. This is because other things can get in the way of these storms. For example, during the 2014/’15 rainy season, a persistent area of high atmospheric pressure developed over the western U.S., diverting the jet stream north and “blocking” storms from approaching the California coast. This “blocking event” was one of the factors contributing to the recent California drought.
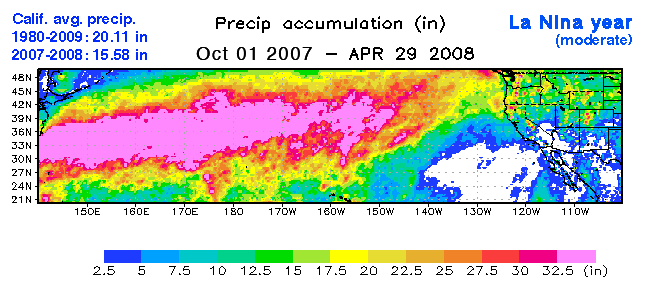
The 1980-2014 seasonal average for California is 19.6 inches of precipitation. The average for the 1997/’98 winter was 31.8 inches, and for the 2013/’14 winter was 11.1 inches.
What will this year bring? Only time will tell but all indications suggest a wet winter for California. Check out our Rain and accumulation section which will be updated as storms come in.
Satellite Rainfall & Accumulation
The above movie shows satellite observations of rainfall from the Tropical Rainfall Measuring Mission (TRMM) satellite. The top map shows winter storms during the current El Niño winter in units of inches per day. The bottom map shows the accumulated rainfall for these same storms.
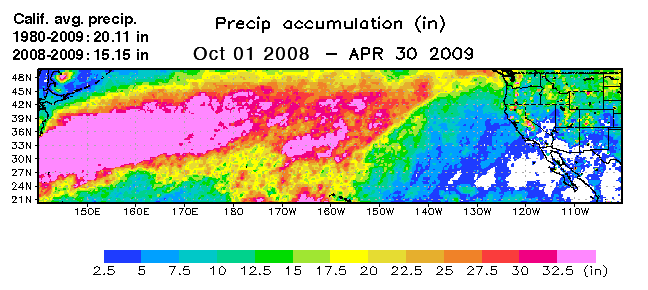
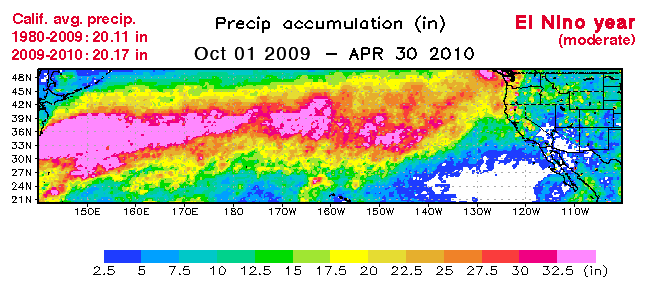
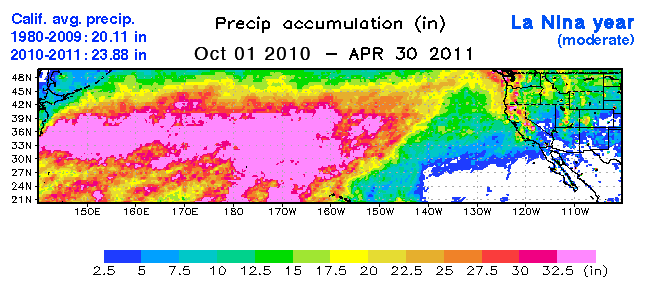
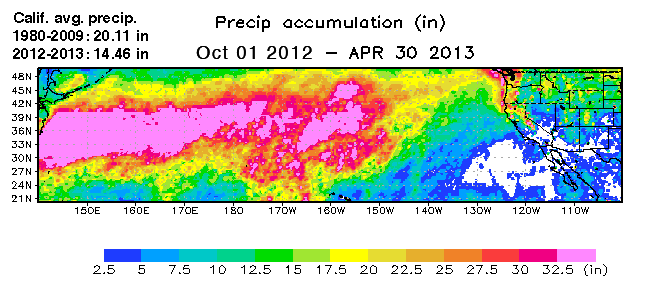
Below is the Oct. through Apr. accumulations for the last ten years. Note the storm track indicated roughly by the yellow – pink colors of previous years compared to this year’s El Nino inspired storm track shaping up.